Metrics System upgrade: Getting More out of your Numbers
All the latest improvements to mod.io stats dashboards; diving deep into your UGC stats, for game studios and content creators alike.
Metrics System Upgrade: Getting More out of your Numbers
Since our Metrics system launched in March of 2023, it’s been used by our partners to dive into their most popular user-generated content (UGC), identify top creators, monitor the activity and moderation for their content, and assist them in taking some informed business decisions; and by content creators and modders to monitor their content success and connect with their community.
Today, we’re here to highlight some of the latest improvements we deployed for your favorite stats reports, improving usability for studios and content creators alike. We’ve been adding new features, improving the user experience and real-time performance, and increasing the data lake available, aiming at making the mod.io metrics dashboard truly world-class. We’re genuinely proud of it, and we believe it’s going to be easy to see why.
If you’d like an intro to our system, we have a dedicated blog article available here to get you up to speed. This will also incidentally give you a good idea of how it looked back then, compared to today.
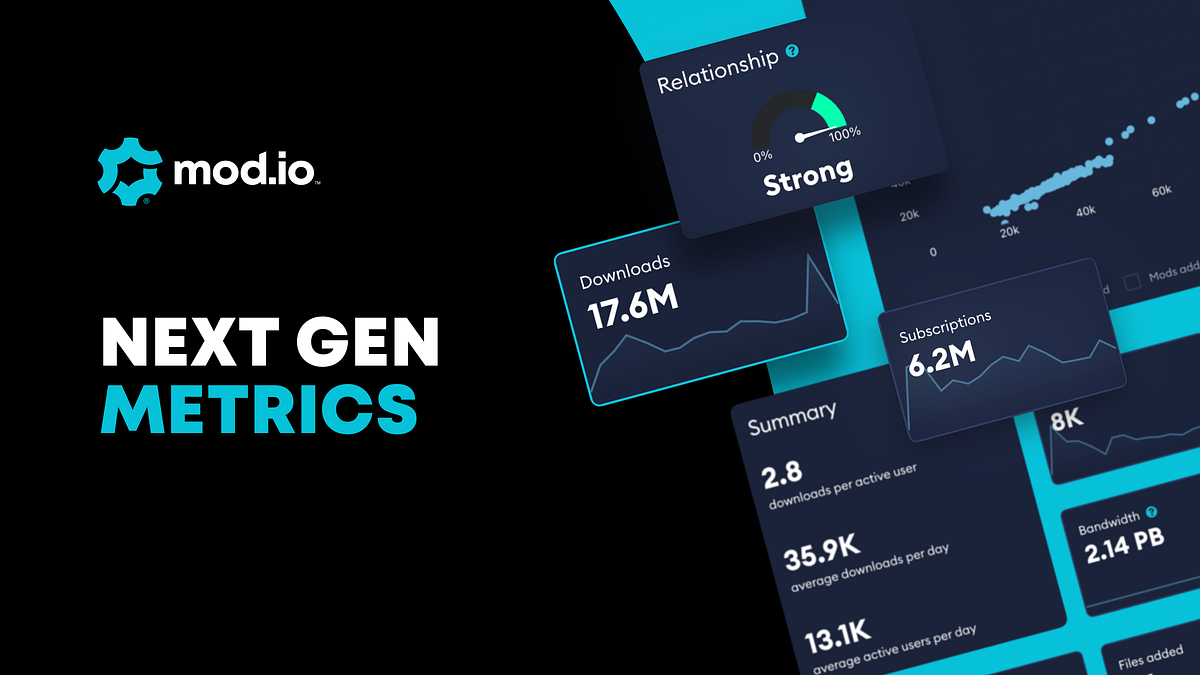
Next-gen Metrics, designed for You!
We started with the basics when we set out to build our Metrics system. And as we continued development, we worked with user personas to make sure our improvements would match the use of people actually working with our metrics. Whether you are a community manager, a content creator, or a product manager, we put ourselves in your shoes and asked ourselves a hundred questions to deploy improvements that make sense for you.
One of the most common requests from our partners was the addition of more data sources to gather information from, so we focused on increasing the size of our data lake. By adding sources like the number of new pieces of content added, new creators that have joined, and health metrics, including the number of reports opened and the quantity of banned content, we’re delivering data that’s actionable for studios and allows them to actively monitor and manage the UGC activity on their games.
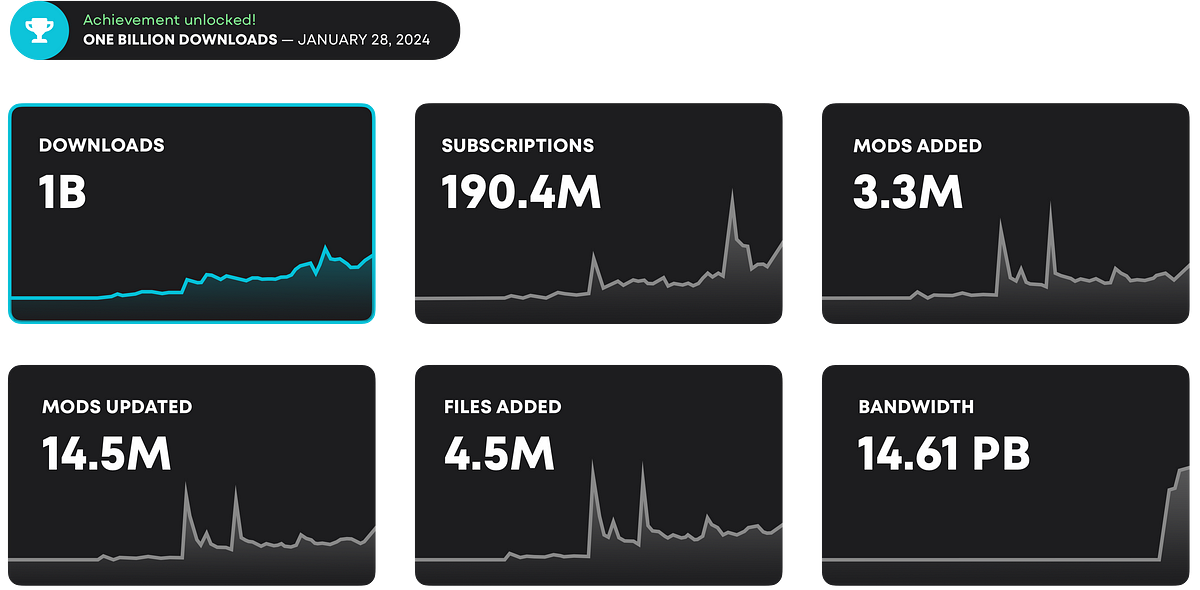
In the same breath, we’ve expanded the scope of our data. Lifetime data is now available for all sources we show. This means that you can see how much UGC activity has grown from launch, and whether there were particular dates which mark a big increase in engagement. Even if your game launched on mod.io before the new Metrics was offered, we’ve been able to migrate your historical data to the new system.
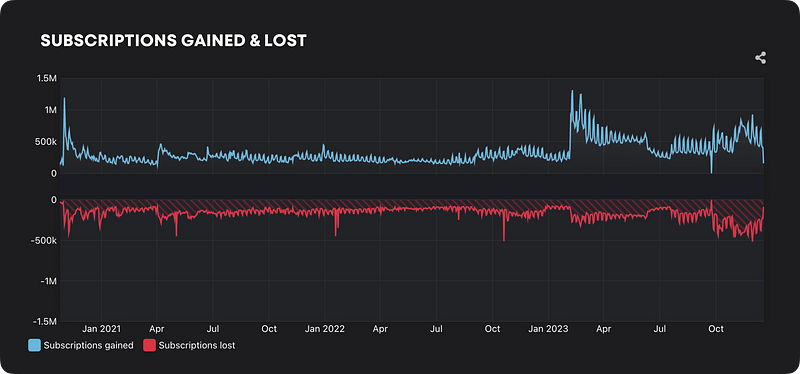
With the scope and breadth of the data increased, we also wanted to increase the readability of data provided. Information like breaking down the net number of subscriptions into positive and negative subscriptions grants our partners a much more in-depth understanding of what is going on with their UGC.
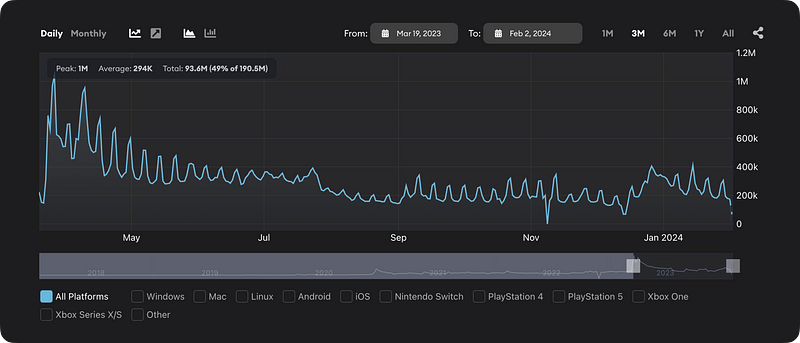
To enable teams to monitor and build quick high-level reporting of UGC activity for their stakeholders, our system now also includes statistics, such as average and peak stats, as well as month-on-month and week-on-week tables from which you can directly pick your key numbers without having to extract them from a graph.
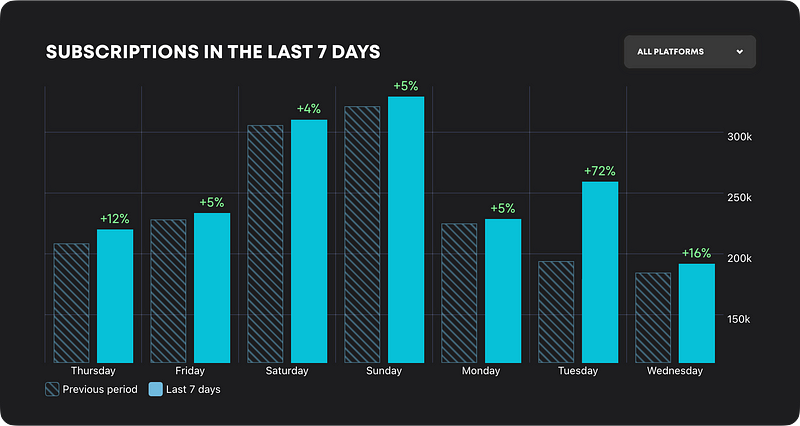
We’ve also added some ways to get a quick overview of activity at a glance with a graph showcasing the activities of the past week. The ability to focus on both the micro and macro of your title’s UGC enables us to cover every level of detail a partner seeks. Whether you’re trying to put together a quick high-level report for your internal stakeholders or dive into the activity to identify popular content & opportunities for community activities or future content, we’ve got you covered.
Harder, Better, Faster, and with improved UI
We’ve taken time to ensure that all this new information is easy to interpret, and put a lot of effort into improving the UI and the performance of the dashboards. On the interface side, we’ve primarily focused on chart interactivity, allowing users to focus on the stats they want.
We’ve added more options, like switching between a ‘per-day’ and ‘cumulative sum’ graph shape to help you find milestones and outliers. You can also switch between daily and monthly grouping, and have added quick-zoom options to see different time periods easily. It looks better and loads faster, as it should.
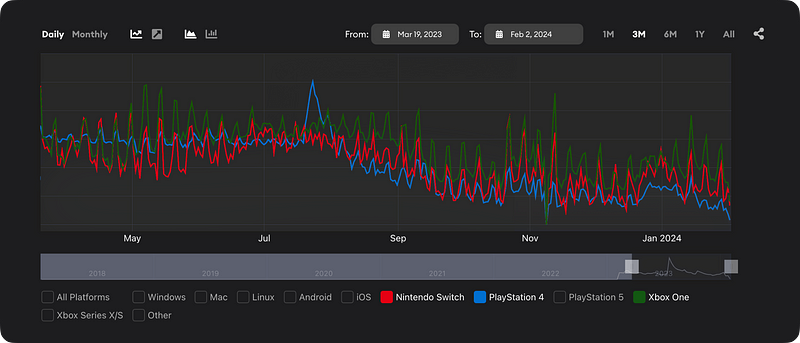
Our graph legend colors now match platforms, so naturally, PlayStation is blue, Microsoft is green, and Nintendo is red. It’s the little details when you work towards building a world-class system.
On the backend, we’ve done our optimizations to make the whole system more responsive, and reduce latency on the download of your metrics. This means today you see refreshed numbers every minute on your dashboards, and our systems are ready to handle more complex metrics in the future. We’ve also sped up graph animations and page loading times to make everything snappier.
Tomorrow’s Metrics of the Future, Today
It feels a bit like we’re going out of early access with these functionalities, but it’s only 1.0 and development isn’t ending there. Our Metrics system will continue to evolve and improve.
Analytics and information are at the heart of all intelligent decisions, so providing our partners with everything they need to make informed decisions and understand their UGC community is what we’re gunning for.
If you’re already working with mod.io and you have feedback or requests for your metrics dashboard, you should reach out! We’re always available on our Discord server and happy to chat about your ideas directly there!
And if you’re considering adding UGC support to your game and want to know what’s performing best and why, contact us today for a demo of our Metrics system.